Stock screeners
Oi2Oi Stocks: OI to OI Support and Resistance
Oi2Oi Stocks is the AOC screener that lists F&O stocks sitting at their highest open interest strike on one side, with the highest open interest on the other side clearly away from it. The idea behind OI to OI trading is simple: buy near the biggest put OI, aim towards the biggest call OI, or the reverse for shorts.
On this page
What is an OI to OI trade?
The strike with the highest put open interest acts as a floor and the strike with the highest call OI acts as a ceiling. An Oi2Oi trade uses those two strikes as the range: enter near one, target the other. The screener finds stocks where price is at one end of that range and the range itself looks clean.
How does a stock get on the Oi2Oi list?
For the Support column, all of these must be true on the latest chain reading:
- Price is very close to the reversal price at the support strike (the S/R Stocks test).
- Support is the strike with the highest put OI.
- The highest call OI strike and the highest call OI change strike are both above support, and the highest put OI change strike is at or above it.
- At the support strike, put OI is not much weaker than call OI.
- No second put strike comes close to the top put OI, so put OI is concentrated at one strike.
And the Resistance column?
It is the mirror. Price is at the resistance reversal price, resistance is the highest call OI strike, the highest put OI and put OI change strikes are below it, the highest call OI change strike is at or below it, put OI at the resistance strike is not much stronger than call OI, and no second call strike comes close to the top call OI, so call OI is concentrated at one strike.
How often does Oi2Oi refresh?
Every 10 seconds while the page is open and visible. A stock is added to the same column at most once every 10 minutes, and repeats are grouped under one row with a ×N badge.
How do I plan an Oi2Oi trade?
- Open Oi2Oi Stocks from the Stock Screener menu.
- Pick a fresh row in Support (long idea) or Resistance (short idea).
- Tap Live to open the option chain. Note the max put OI strike and the max call OI strike: that is your range. For example, ICICIBANK at 1,201 with max put OI at 1,200 and max call OI at 1,240 gives you roughly 40 points of room.
- Tap the Support or Resistance cell in the chain header to open the Oi2Oi Max OI CE & PE chart and check that both strikes have held steady through the day.
- If the room to the other end is small compared with your stop, skip it. Otherwise set your stop beyond the level, size the trade and place it with your broker.
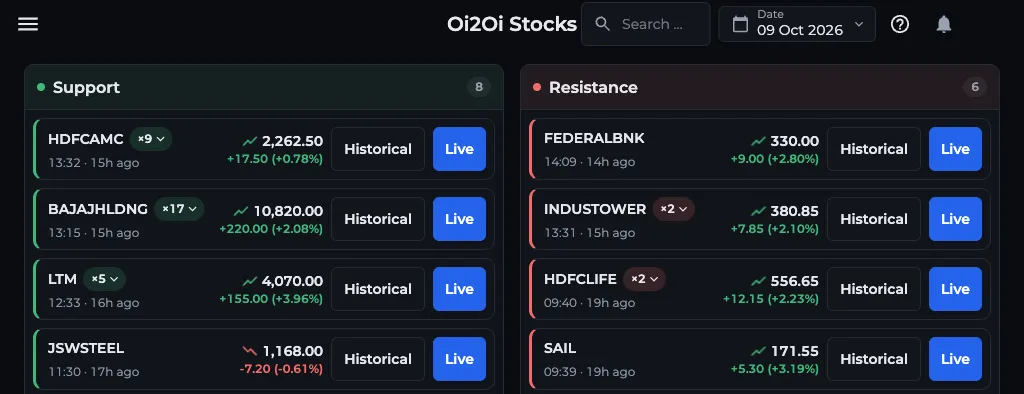
- 1Support column with its count
- 2×N badge: tap to see every signal
- 3Historical opens the Back Tester
- 4Live opens the option chain
- 5Date picker for past sessions
What are the limits?
Oi2Oi Stocks is analysis, not a buy or sell recommendation. It needs AOC Pro; see pricing.
- The max OI strikes can shift during the day. If the call side moves down, your target moves with it.
- The screener does not give a target or stop-loss and does not tell you the trade worked.
- Concentrated OI can still be unwound quickly near expiry.
- Rows stay on the list for the day even after the setup changes.
Frequently asked questions
What does Oi2Oi mean in AOC?
Oi2Oi stands for OI to OI: trading from the strike with the highest put OI towards the strike with the highest call OI, or the other way for a short. The Oi2Oi Stocks screener lists F&O stocks sitting at one end of such a range.
Is Oi2Oi for intraday or swing trading?
The list is built from intraday option chain readings and refreshes every 10 seconds, and signals are stamped with the time they appeared. How long you hold depends on your own plan and how far the opposite max OI strike is.
How do I see the Oi2Oi levels for a stock over the day?
Open the stock's live option chain and tap the Support or Resistance cell in the header. That opens the Oi2Oi Max OI CE & PE chart, which plots the max call OI and max put OI strikes through the session.
Why is a stock at max put OI not on the Oi2Oi list?
Price must also be very close to the support reversal price, the call side's max OI and max OI change must be above support, and put OI must be concentrated at one strike rather than spread across two. Missing any one keeps it off.
Last updated