Strike tools
Strike Support, Resistance and Reversal Prices (EOS/EOR)
Strike support and resistance in AOC are the underlying prices where the call and put premiums around a strike balance out, worked out live for every strike in the chain. Traders call them the elastic ends of a strike: the support (EOS) and resistance (EOR) reversal prices where the market tends to bounce, or extends if it breaks through.
On this page
How do I see a strike's support and resistance?
Tap the strike price cell in the middle column of the live chain (AOC Pro) or the Back Tester. The Support & Resistance pop-up opens with that strike in the title, for example Support & Resistance · 22500.
At the top pick the price basis: Spot, Future or Weekly Future. Below are two blocks. Average (9:30 AM) holds the levels taken at 9:30 AM, a fixed reference; Current holds the levels from the latest tick. Each block shows Resistance in red and Support in green to four decimals. Tap a value to copy it.
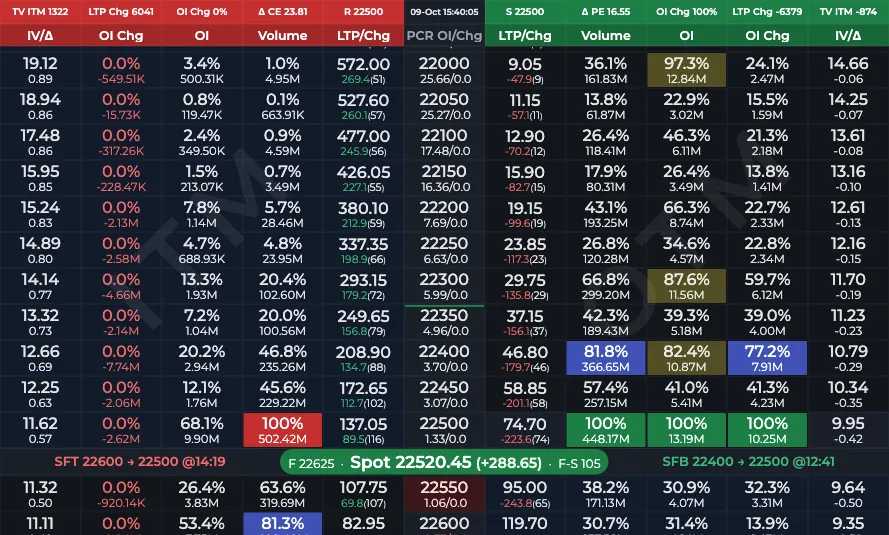
- 1Tap the strike price cell
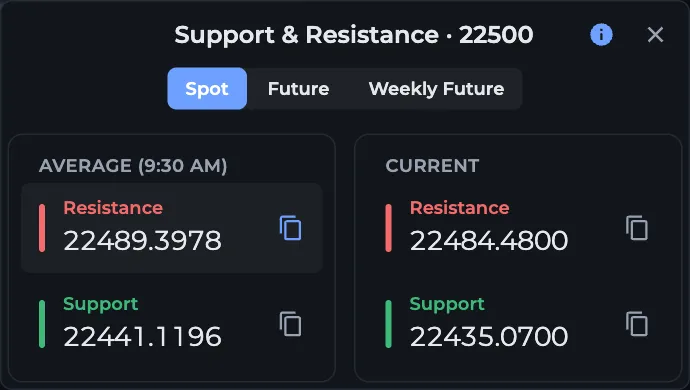
- 1Spot, Future or Weekly Future
- 2Average (9:30 AM) levels
- 3Current levels from the latest tick
- 4Tap a value to copy it
How are the reversal prices calculated?
AOC reads the live call and put premiums around each strike and finds the underlying price where the two sides balance. Below the strike that balance point is its support; above it, its resistance. You do not need the maths to use them: the levels update with every tick.
So if the 22,500 CE and the 22,450 PE are both near 95 right now, the 22,500 support sits close to the current spot. If the call is much richer than the put, support sits well below spot.
A level shows 0 when it cannot be worked out, for example the lowest strike in the chain has no support and the highest has no resistance.
What other places show these levels?
- Volume cell: tapping it opens a small Strike Price pop-up with just the CE resistance or the PE support of that strike, to two decimals, tap to copy. On the live chain this happens only when order placement is off (Settings, Trading, Enable trading) or AliceBlue trading is not available to you; otherwise the Volume cell opens the order ticket. In the Back Tester it always opens the pop-up.
- Rev LTP/Spot column: hidden by default, turn it on in Settings, Option chain, Columns. The lower number is the leg's reversal price (CE: resistance, PE: support); tap it to copy. The upper number is the option's estimated premium if the underlying reaches the day's in-range level (support for calls, resistance for puts).
- Red-tinted strike cell: the strike whose support and resistance bracket the current price, using the 9:30 averages when they exist. That is the strike the market is trading inside.
How do traders use EOS and EOR?
The in-range strike gives you a box. A call buyer waits for the price to come down to the support and uses the LTP Calculator to price the entry there. A put buyer does the same at resistance. If the price closes through a level and the next strike's level starts holding, that is the extension: the move continues to the next box.
The Average block is your anchor for the day. The Current block drifts with premiums, so when Current support climbs above the Average one, call buyers are paying up and the floor is rising. The Reversal Chart plots exactly that pull over time.
Worked example on BANKNIFTY
BANKNIFTY spot is 48,230. The 48,200 strike cell is tinted red. You tap it and, on Spot, read Average support 48,152.40 and resistance 48,286.10, Current support 48,171.85 and resistance 48,304.60.
Both current levels are above the averages, so the box has shifted up since the open. You copy 48,171.85, open the 48,200 CE LTP Calculator, paste it and see the premium to bid for a buy at support. If spot instead breaks 48,150 and stays there, you stop treating 48,200 as support and look at the 48,100 strike's levels.
Frequently asked questions
What is EOS and EOR in the option chain?
EOS is the support reversal price of a strike and EOR the resistance reversal price. AOC works them out from the live call and put premiums around the strike, as the underlying price where the two sides balance.
What is the difference between Average (9:30 AM) and Current?
Average holds the levels taken at 9:30 AM, so they stay put as a reference. Current is recalculated from the latest premiums and moves through the session.
Why does the support or resistance show 0?
The level could not be calculated: it is the lowest or highest strike in the chain, the strike has zero delta, or the support to resistance gap came out wider than two strike steps and was discarded.
Why does tapping Volume open an order window instead of the strike price?
Order placement is switched on. Turn off Enable trading in Settings under Trading and the Volume cell opens the Strike Price pop-up again.
Last updated