Option chain
Market Mood Index in AOC: Read the MMI Gauge
The Market Mood Index (MMI) in AOC is a 0 to 100 fear and greed gauge for the Indian market, shown free on the home page with a history chart. Traders glance at it before the open to judge whether the crowd is scared or greedy, then confirm with the option chain.
On this page
Where is the Market Mood Index in AOC?
On the home page, in the Market Mood Index card next to the quick action tiles. It is free and works without a login. It is not on the option chain screen itself.
For the idea behind it (what fear and greed readings mean and why contrarians like it), read the Market Mood Index glossary page. This page is about using the gauge in the app.
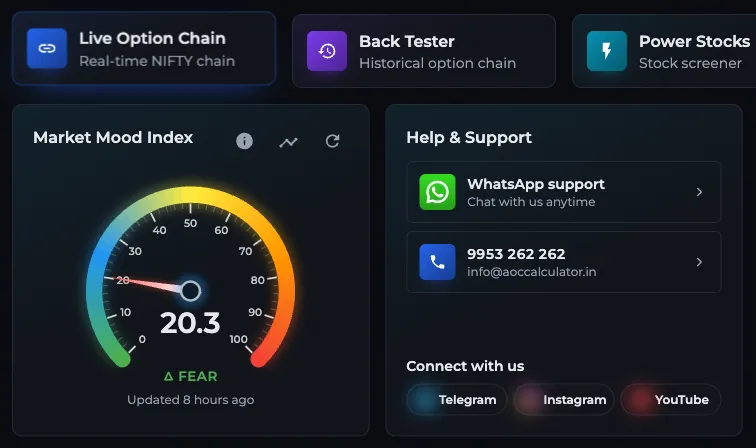
- 1MMI value and zone label
- 2Info icon: what each zone means
- 3MMI history chart
- 4Refresh the reading
- 5How fresh the reading is
How do I read the MMI gauge?
The needle sweeps from 0 on the green end to 100 on the red end. Under the hub you get the value with one decimal, say 34.6, and a label. The label follows these bands:
- Below 30: Extreme Fear
- 30 to 49.9: Fear
- 50 to 69.9: Greed
- 70 and above: Extreme Greed
What do the three buttons on the card do?
Below the gauge, "Updated 2 hours ago" tells you how fresh the reading is; after a day it shows the date instead. Three icons sit at the top right of the card:
- Info icon: four cards that explain each zone and what traders usually do there. The cards use the same zone edges (30, 50 and 70); read them as rough zones, not hard lines
- Trend icon (MMI history): a line chart of past MMI readings with marker lines at 20 and 30 on the fear side and 70 and 80 on the greed side
- Refresh icon: fetches the latest value. The server caches it for up to 30 minutes, so tapping refresh every minute will not give you a new number
How do I use MMI with the option chain?
- Before 9:15 IST, open the home page and note the MMI value, its label and the direction on the history chart.
- Open the live option chain for NIFTY and check the PCR colour of the spot bar and where the red and green OI boxes sit.
- If MMI is in Extreme Fear and still falling, wait. If it is turning up from Extreme Fear and put writers are adding OI at a support strike, that is the kind of agreement worth a closer look.
- If MMI is in Extreme Greed, be careful with fresh longs. Look for call writers piling up at a strike above spot and watch the SFT/SFB labels for resistance moving down.
- Recheck later in the day. MMI moves slowly, the chain moves every snapshot, so let the chain decide your timing.
When should I not rely on MMI?
MMI describes the whole market's mood, not a single stock or a single expiry. A BANKNIFTY setup or a stock with fresh OI buildup can move against the broad mood, so never take a trade on MMI alone.
It is also slow. A sudden gap on news shows up in the chain long before the mood reading catches up. MMI is a sentiment reading, not a buy or sell signal, and AOC does not give investment advice.
Frequently asked questions
Is the Market Mood Index free in AOC?
Yes. The MMI gauge and its history chart on the AOC home page are free and do not need a login or an AOC Pro plan.
What does an MMI of 25 mean?
In AOC's gauge, 25 reads as Fear: the crowd is nervous but not panicking. What to do depends on direction: falling from Greed usually means waiting, rising out of Extreme Fear can mean looking for fresh positions.
How often is the Market Mood Index updated?
The card shows how long ago the current reading was updated, for example Updated 2 hours ago. The app caches the value for up to 30 minutes, so refreshing more often than that usually shows the same number.
Can I see past MMI values?
Yes. Tap the trend icon on the Market Mood Index card to open the MMI history chart, which plots past readings with marker lines at 20, 30, 70 and 80.
Last updated