Market data
FII DII Data: Daily FII, DII, Pro and Client Activity
FII / DII Data in AOC is a daily view of how four participant groups (FII, DII, Pro and Client) traded index futures, stock futures, calls and puts, turned into bullish or bearish reads and a combined market pulse. F&O traders check it before the open to see which way the big money leaned in the previous session.
On this page
What do the numbers mean?
Every figure is the day's net number of contracts for one participant in one instrument. +45,000 in FII Index Future means a net +45,000 index futures contracts on the long side for FIIs that day.
The four participants are FII (foreign institutions), DII (domestic institutions), Pro (proprietary desks of brokers) and Client (everyone else, mostly retail).
These are traded contracts for the session (what each group actually bought and sold during the day), not open interest. Most FII / DII tables only show open positions, which hide how much a group traded in and out intraday. The figures arrive once per session, after the market closes.
Which way does each instrument read?
Each participant card adds up its four reads and shows a label: Strong bullish when at least half the reads net out bullish, Bullish when the net is above zero, Neutral at zero, and the same on the bearish side.
- Index Future: positive is bullish, negative is bearish.
- CE: positive (net call buying) is bullish, negative is bearish.
- PE: the opposite. Positive (net put buying) is bearish, negative is bullish.
- Stock Future: positive is bullish, negative is bearish.
What is the market pulse?
Market pulse · FII + Pro sits at the top. It combines the eight reads of FII and Pro (four instruments each) into one label and a meter from Bearish to Bullish, plus a line such as "Across Index Future, CE, PE and Stock Future, FII leans bearish, while Pro leans bullish."
Client and DII cards are still shown. DII carries a note that it is not part of the pulse. The pulse uses FII and Pro because those two are usually read as the informed side of the F&O market.
How do I read the FII / DII page?
- Open FII / DII Data from the side menu. It loads the latest session by default; the line under the heading shows the date.
- Read the Market pulse label and the FII and Pro chips under the meter.
- In Positions, keep By participant to see each group's four reads, or switch to By instrument to compare all four groups on one instrument with bars from a zero line.
- Tap any figure, say FII PE, to open its history chart: Net contracts · last 30 sessions with the Latest net on top.
- Use the arrows or the date button to step to an earlier session, and Latest to come back.
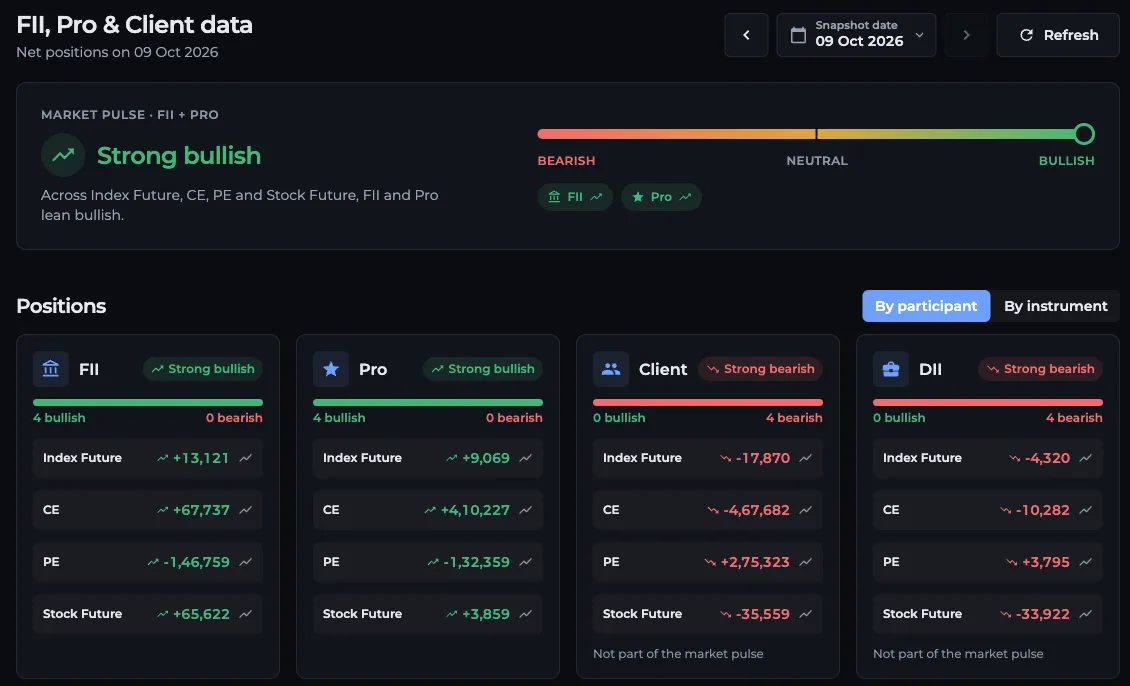
- 1Market pulse label
- 2FII and Pro chips
- 3By participant or By instrument
- 4Tap a figure for 30-session history
- 5Step sessions or pick a date
What is a sensible way to use it?
Look for agreement. If FII Index Future is negative, FII PE is positive and the 30-session chart shows that put position building for a week, that is a consistent bearish stance. One day of +10,000 calls on its own means little.
Compare with Client. Clients often sit on the other side of FII in index options, so a strong FII read with Client the opposite way is a common pattern, not a contradiction.
Then check today's live picture in Market Overview or the option chain. Yesterday's positions do not tell you today's direction by themselves.
Is FII / DII data free?
Yes. The page is public and works without a login. FII / DII data is an analysis aid, not investment advice.
Frequently asked questions
How do I read FII DII data for F&O?
Look at each participant's net contracts in index futures, stock futures, calls and puts. Positive futures and call numbers read bullish, positive put numbers read bearish. AOC labels each read and combines FII and Pro into a market pulse.
Why is a positive PE number bearish?
A positive PE figure means the participant was a net buyer of puts that day, which is a bet on or a hedge against a fall. So AOC reads it as bearish, and a negative PE figure as bullish.
Why is DII not part of the market pulse?
AOC's market pulse combines only FII and Pro positions. DII figures are shown for reference on their own card and in the By instrument view, but they do not change the pulse.
Can I see FII data for previous days?
Yes. Use the date button or the previous and next arrows to load any session in the list. Tap any figure to see that participant and instrument across the last 30 sessions.
Does AOC show FII intraday activity or only open interest?
It shows the intraday activity of each session: the net contracts every group traded during the day, rather than only its open interest. The figures update once per session after the close, so for live direction during market hours use Market Overview or the live option chain.
Last updated