Strike tools
Time Value Chart: TV CE, TV PE and ITM Time Value
Time value in AOC is the part of option premiums that is not intrinsic value, added up across strikes for calls and for puts and charted through the day. Comparing call time value with put time value shows which side traders are paying extra for, and how fast that premium is melting.
On this page
Where does AOC show time value?
All of these are on the option chain: live with AOC Pro, or replayed in the Back Tester.
- TV CE x% and TV PE x% below the chain: the call and put shares of total time value. Tap either to open the Time Value chart.
- TV ITM in the chain header, on both sides: the time value of in-the-money options. Tap it to open the ITM TV Chart.
- The green CE and red PE boxes beside Max Pain below the chain: time value of the 3 strikes below and 3 above spot, updated live.
- Every LTP/Chg cell: the number in brackets after the change is that option's own time value, in red when negative.

- 1Tap TV CE % for the Time Value chart
- 2CE and PE boxes beside Max Pain
How is time value calculated?
For one option it is LTP minus intrinsic value. Intrinsic value is spot minus strike for a call and strike minus spot for a put, never below zero. Read the basics in time value.
TV CE / TV PE add up the time value of the strikes in the band around the chain's current support and resistance, counting a negative value as zero. TV ITM adds the time value of in-the-money options only (calls below spot, puts above spot), skipping strikes with no volume, so it can go negative. The near-spot boxes add the 3 strikes either side of spot (future if spot is not available) without clipping.
What do the chart lines mean?
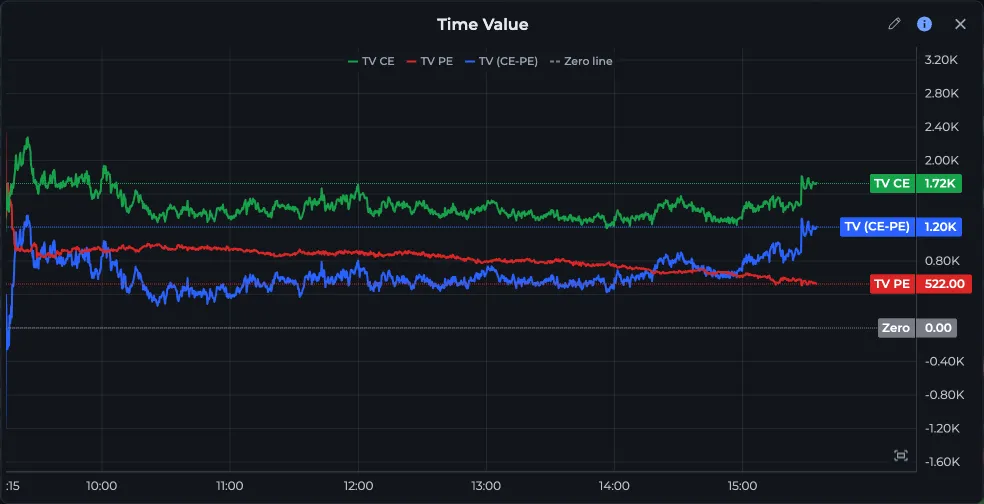
The Time Value chart and the ITM TV Chart use the same layout: a green CE line (TV CE or ITM TV CE), a red PE line, a blue CE minus PE line and a dashed grey Zero line. Tap a legend chip to hide a line. On the live chain they refresh every 10 seconds.
- 1Legend: TV CE, TV PE, TV (CE-PE)
- 2Zero line toggle
How do I read time value?
- Check the TV CE and TV PE split. A clear tilt to one side shows where the extra premium is being paid.
- Open the Time Value chart and look at the blue CE minus PE line. A steady fall means put premium is gaining on call premium.
- On the ITM TV Chart, a line that drops below zero means in-the-money options are trading below intrinsic value on that side, usually because sellers are pressing.
- Use the near-spot boxes for a quick at-the-money read during the session.
Worked example
At 10:15 NIFTY is at 22,480. The footer reads TV CE 41% and TV PE 59%, and the near-spot boxes show CE 312.40 and PE 401.75. Puts are carrying the extra premium.
In the Time Value chart the blue CE minus PE line has gone from minus 40 at the open to minus 165. Put buyers have been paying up all morning. With a bearish read from CE / PE buildup, that is a reason not to sell puts cheaply today.
Frequently asked questions
What is TV CE and TV PE in the AOC option chain?
They are the call and put shares of total time value across the strikes around the chain's support and resistance. TV CE 40% and TV PE 60% means puts hold more of the extrinsic premium.
What does negative time value mean?
It means the option trades below its intrinsic value. It happens mostly in deep in-the-money options with thin trading, or when sellers are hitting bids hard. AOC shows it in red in the LTP cell and the ITM TV chart can go below zero.
Which strikes are used for the near-spot CE and PE time value?
The 3 strikes just below spot and the 3 just above. If spot is not available, the future price is used instead.
Last updated