Strike tools
LTP Change Chart: Call vs Put Premium Change
The LTP Change chart in AOC, titled LTP Change of Day Range, adds up the day's premium change of all calls and of all puts in the band around the chain's support and resistance, and plots both through the day. It is a quick way to see whether call buyers or put buyers are winning today, and when that flips.
On this page
Where do I find the LTP Change chart?
Tap LTP Chg in the chain header, on either the CE side or the PE side. Both open the same chart. The number in the header cell is the current sum for that side. It works on the live chain (AOC Pro) and in the Back Tester.
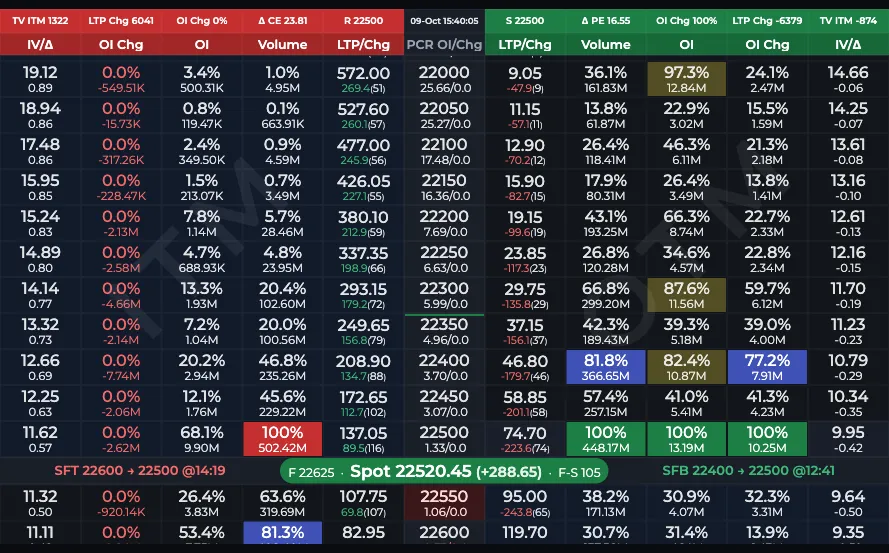
- 1LTP Chg on the CE side
- 2LTP Chg on the PE side
How is the LTP change sum calculated?
For each strike in the band around the current support and resistance, AOC takes the option's change from the previous close (the change shown in the LTP/Chg cell) and adds them up, separately for calls and puts. Because the band follows support and resistance, the strikes counted can change during the day when the levels shift.
What do the lines mean?
Tap a legend chip to hide a line. On the live chain the chart refreshes every 10 seconds.
- LTPChng CE (green): summed call premium change.
- LTPChng PE (red): summed put premium change.
- LTP (CE-PE) (blue): the call sum minus the put sum.
- Zero line (dashed grey): no change.
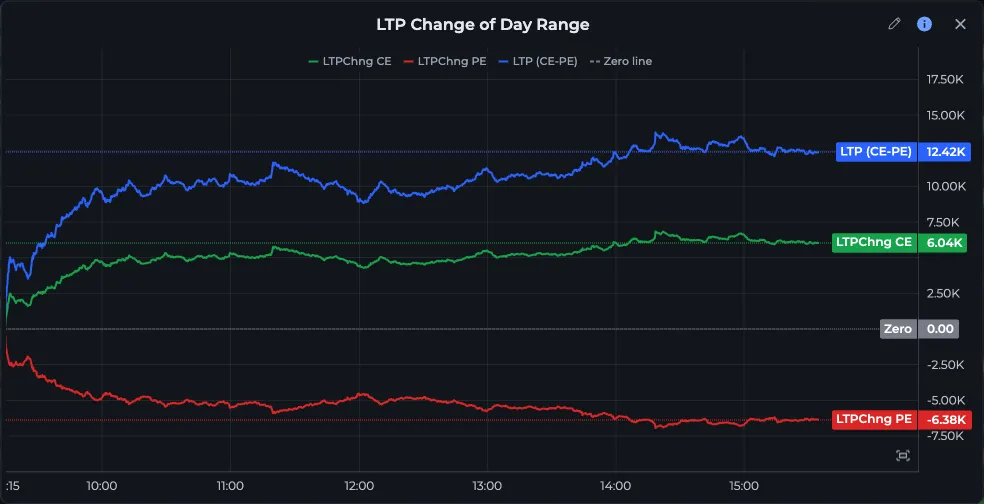
- 1Legend: LTPChng CE, LTPChng PE, LTP (CE-PE)
- 2Zero line toggle
How do I read it?
- Look at the side of zero each line is on. Calls up and puts down is a bullish day for the index so far; the reverse is bearish.
- Follow the blue line. Its crossing of zero is the moment the day's balance flips from puts to calls or back.
- Compare the slope with price. If NIFTY makes a new high but the blue line does not, call premiums are not keeping up, often because of time decay or falling IV.
- Confirm with time value and the future buildup before acting.
Worked example
NIFTY opens flat. By 10:30 the header reads LTP Chg 184 on the CE side and minus 236 on the PE side, and the blue line is at plus 420: a clearly bullish morning.
After 13:00 the blue line slides back to plus 90 even though NIFTY is only 20 points off its high. Calls are bleeding, puts are firming. You book part of a long call rather than wait for a fresh high.
Frequently asked questions
What does LTP Chg mean in the AOC option chain header?
It is the sum of the day's premium change of calls (CE side) or puts (PE side) for the strikes around the chain's support and resistance. Tap it to see how that sum moved through the day.
What does it mean when the CE-PE line crosses zero?
Summed call premium change and put premium change are equal at that moment. A cross from below to above means calls have overtaken puts for the day; a cross downward means the reverse.
Is the LTP change chart a trading strategy on its own?
No. It shows which side is gaining premium, but premium also moves with IV and time decay. Use it with price, buildup and time value. AOC is an analysis tool, not investment advice.
Last updated