Market data
Sectorial Data: Live Sector Indices and Stock Breakdown
Sectorial Data in AOC is a live board of NSE sector indices that shows each sector's price, percentage change and advance/decline breadth, and opens into the stocks behind each move. When NIFTY moves, this is where you check which sectors are pulling it, and which heavyweight inside a sector is doing the work.
On this page
Where do I find Sectorial Data?
Open the side menu, go to Sector Analysis and pick Sectorial Data. The sector strip on the home screen also links here.
You need to be logged in to see the board.
What does each sector card show?
At the top, three counters show how many sectors are Advanced, Declined and the Total. Sectors at zero change count as advanced.
Each card then shows the sector name (AUTO, PSU BANK, IT and so on), its last price, the percentage change in bold with the points change under it, a small green/red breadth bar with counts like 34↑ 16↓, and the number of stocks in the index.
A green stripe on the left means the sector is up on the day, red means down.
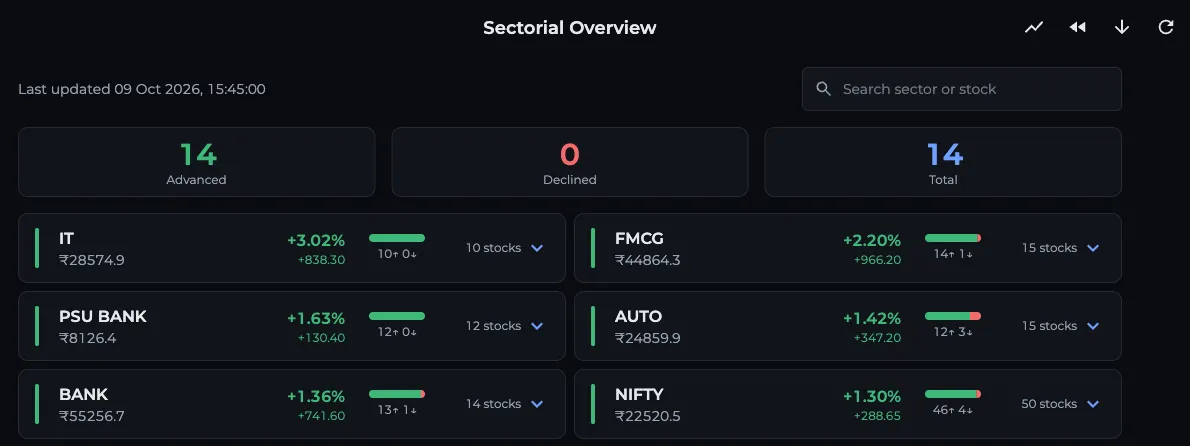
- 1Advanced, Declined and Total
- 2Tap a sector card to expand it
- 3Search sector or stock
- 4Intraday Chart of sector moves
- 5Sort, replay and refresh
How do I read the stock breakdown?
Tap a sector card to expand it. The constituents table has six sortable columns:
- Symbol: the stock. If it trades in F&O, the name is a link to its option chain.
- Price, Chg and %Chg: last price and the day's change.
- Wt%: the stock's weightage in that sector index.
- WChg: weighted change, which is %Chg multiplied by Wt%. This is roughly how much that one stock moved the index.
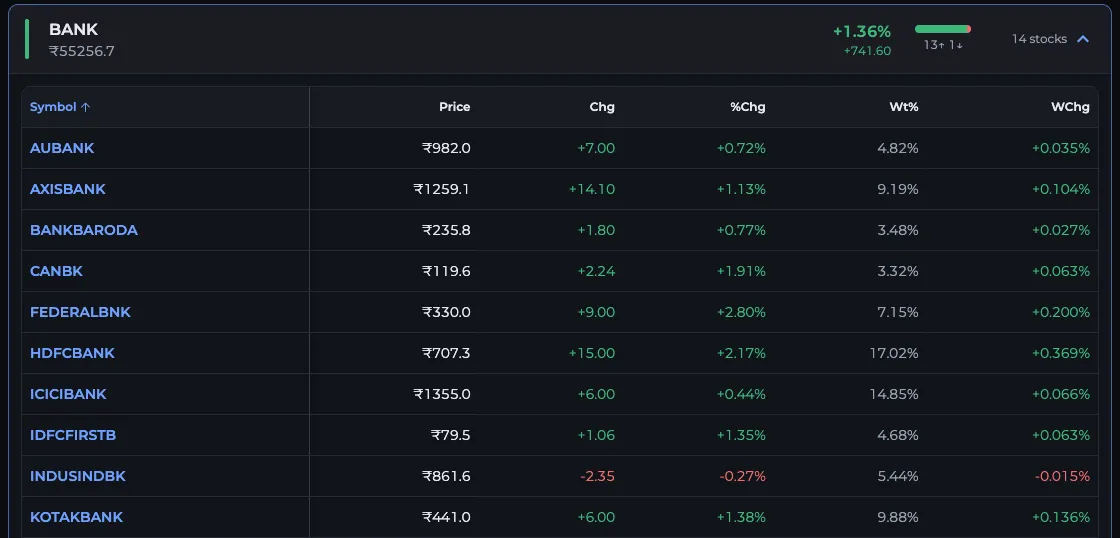
- 1Symbol links to its option chain
- 2Wt%: weightage in the index
- 3Tap WChg to sort by weighted change
- 4Breadth bar with up and down counts
How do I find what is moving a sector?
If Screener quick access is on in settings, the option chain opens in a popup on the same page. Ctrl, Cmd or Shift-click still opens the full page.
- Leave the sort on its default (biggest gainers first) or tap the sort button to flip it and see the weakest sectors on top.
- Tap the sector you care about, say BANK, to open its constituents.
- Tap the WChg header to sort by weighted change. If HDFCBANK is down 1.2% with a 28% weightage, its WChg is about -0.34%, which can outweigh three smaller banks that are up.
- Check the footer: Total, Positive, Negative and Avg % tell you whether the move is broad or carried by one or two names.
- Tap a symbol to jump to its live option chain and read the strikes.
What does the Intraday Chart show?
The chart button opens a line chart of each sector's percentage change from the morning to now. It starts with NIFTY plus the sectors with the biggest moves, up to 8 lines at once. Tap the sector chips under the chart to swap lines in and out.
The Interval menu sets the spacing between points: 1 min (default), 5 min, 10 min, 15 min, 30 min or 1 hour. Use 15 min when you only want the shape of the day.
How do search, sort and refresh work?
The search box takes a sector or a stock name. Type RELIANCE and you see every sector that holds it, with the matching row already open.
The board refreshes every 30 seconds while the tab is visible, and the Last updated time shows the IST timestamp of the data. The refresh button reloads it on demand.
To look at an earlier moment, use the replay button to open Sectorial Replay.
Do I need a plan for Sectorial Data?
The sector board and the Intraday Chart only need a login. The live stock breakdown inside each sector needs a paid AOC plan; without one, expanding a sector shows the plans instead of the table.
Frequently asked questions
What is weighted change (WChg) in sectorial data?
Weighted change is a stock's percentage change multiplied by its weightage in the sector index. It shows roughly how much of the index move came from that stock. A heavyweight with a small move can matter more than a small stock with a big move.
How often does sectorial data update in AOC?
The Sectorial Data page reloads every 30 seconds while the browser tab is visible. The Last updated line shows the time of the latest data in IST.
Can I see which stocks are moving a sector?
Yes. Expand the sector card to see every constituent with price, change, weightage and weighted change. Sort by WChg to see the stocks pushing the index most. The live breakdown needs a paid AOC plan.
How do I compare sectors through the day?
Open the Intraday Chart from the toolbar. It plots the percentage change of up to 8 sectors at once from the morning, at intervals from 1 minute to 1 hour.
Last updated