OI graphs and back testing
All OI Bar Graphs: OI, OI Change and GEX by Strike
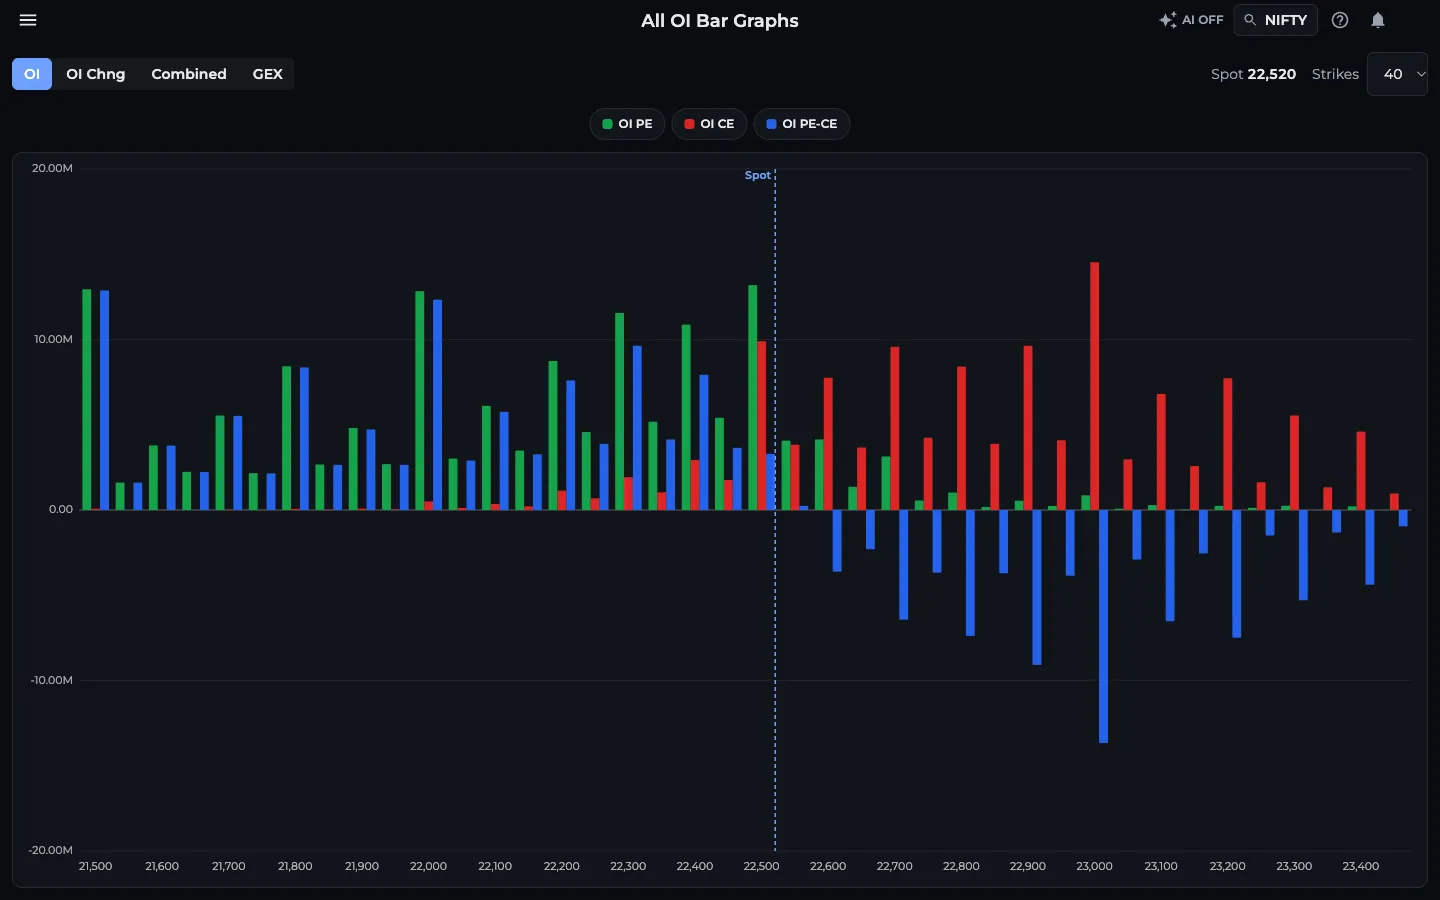
All OI Bar Graphs is the AOC page that draws open interest, OI change, combined OI build-up and net gamma exposure (GEX) as bars for every strike of the live option chain, with a marker at the spot price. It is the quickest way to see where put and call writers are stacked and how that changed today, without reading the chain row by row.
On this page
Where do I find the OI bar chart?
Menu, then Charts & Graphs, then All OI Bar Graphs. It is also a tab in Tabbed AOC.
It needs a login and an active AOC plan (AOC Pro or higher); see pricing. Switch symbol with the search in the top bar and use AI for the AI chain. Bars come from the live option chain feed and update on their own.
What are the controls?
- Tabs: OI, OI Chng, Combined and GEX.
- Spot: the current spot price, also drawn as a dashed vertical marker on the chart.
- Strikes: how many strikes around the at-the-money strike to show, 20, 40 (default), 60 or All.
- Legend chips above the chart hide or show each bar series.
- On the chart, hover or tap a strike for exact values. Scroll or drag on the strike axis to zoom, drag the chart sideways to pan, and double-click the axis to see all strikes again.
- 1Tabs: OI, OI Chng, Combined, GEX
- 2Legend chips hide or show a series
- 3Spot price readout
- 4Strikes: 20, 40, 60 or All
- 5Dashed spot marker
What do the OI and OI Chng bars mean?
On OI, each strike gets three bars: OI PE (green), OI CE (red) and OI PE-CE (blue). The tallest green bar is where the most puts are open, which traders treat as support. The tallest red bar is the call wall, read as resistance.
On OI Chng, the same three bars show today's change in OI: OIChng PE, OIChng CE and OIChng PE-CE. Bars below zero mean positions were closed today.
How do I read the Combined chart?
Combined stacks today's change on top of the open interest so you see both in one bar per side. Puts are green, calls red.
- Solid bar (Put OI, Call OI): OI that was already there, net of anything added today.
- Hatched part (Put OI (+), Call OI (+)): OI added today.
- Hollow outline (Put OI (-), Call OI (-)): OI removed today, drawn on top so you can see how tall the bar was at the previous close.
Worked example: reading Combined bars
NIFTY spot is 24,560. The 24,500 put bar has a 55 lakh solid base with a 25 lakh hatched cap: 80 lakh open, 25 lakh of it written today. Put writers added heavily just below the market, so 24,500 is the support to watch.
The 24,700 call bar shows a 40 lakh solid base and a 15 lakh hollow outline above it. Call OI fell from 55 lakh to 40 lakh today, so call writers there are leaving. Resistance at 24,700 is weakening, and if 24,800 calls show hatched caps at the same time, the call wall is moving up.
What does the GEX tab show?
GEX is net gamma exposure per strike, worked out as (call OI x call gamma minus put OI x put gamma) x spot x spot x 1%. It uses the Greeks in the chain.
Net GEX + (red) means call gamma outweighs put gamma at that strike; Net GEX - (green) means put gamma outweighs call gamma. Both are drawn upwards so the size is easy to compare, and the colour tells you the sign. The tooltip keeps the signed value.
Many traders read large positive GEX zones as areas where price tends to stick, and negative zones as areas where moves can speed up. Treat it as context next to OI, not a signal on its own. The GEX tab always reads the regular chain, even when AI is on.
Frequently asked questions
What is the Combined OI chart in AOC?
It is a bar per strike and side where the solid part is OI carried from before today, the hatched part is OI added today and a hollow outline shows OI removed today. You see total OI and today's change in one bar.
How is GEX calculated in AOC?
For each strike AOC takes call OI times call gamma, subtracts put OI times put gamma, and multiplies by spot squared and by 1%. Positive values are red bars, negative values are green bars, both drawn upward.
Can I see the OI bar graph for a past date?
Not on this page, it always shows the live chain. Use OI Graphs Replay to see the same OI, OI change, Combined and GEX bars at any moment of a past session.
Why do I see only some strikes?
The Strikes selector shows 40 strikes around the at-the-money strike by default. Set it to 60 or All to see more, or zoom on the strike axis to look closer at a few.
Last updated