OI graphs and back testing
Multi Percentage Graphs: Volume and OI % by Strike
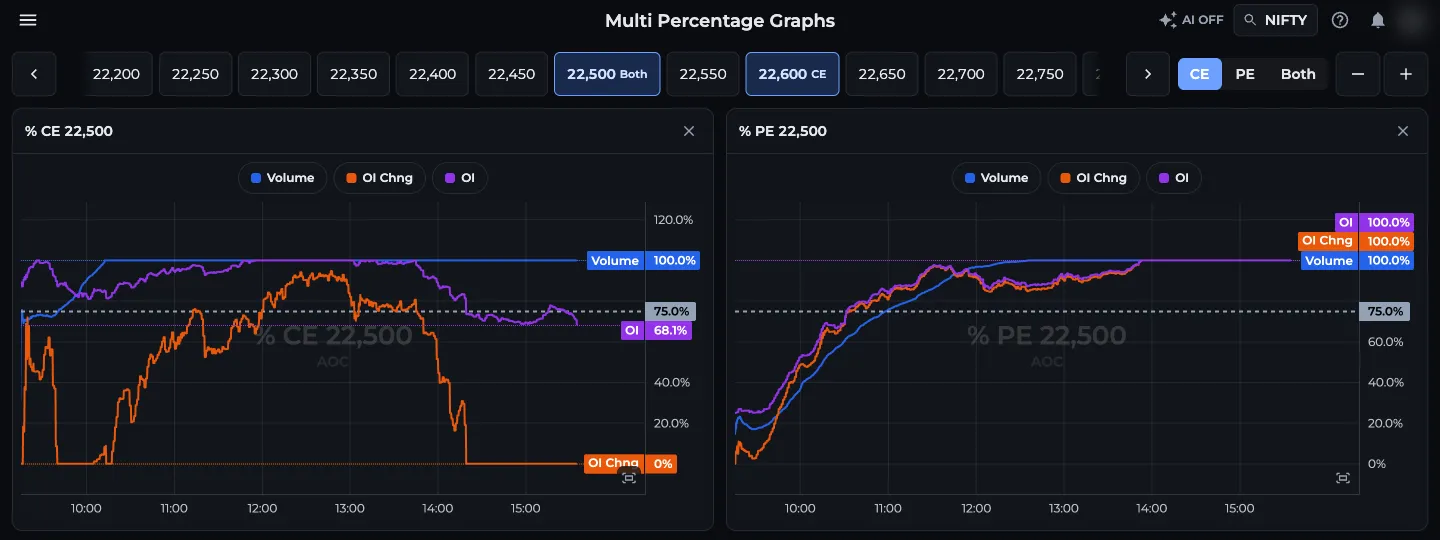
Multi Percentage Graphs is the AOC page that charts volume %, OI % and OI change % through the day for several call and put strikes at once, each on its own card. Each percentage compares the strike with the highest value in that column of the option chain, so you can watch a strike rise towards becoming the day's top volume or OI strike.
On this page
Where do I find Multi Percentage Graphs?
Menu, then Charts & Graphs, then Multi Percentage Graphs. It is also available as a tab in Tabbed AOC.
It needs a login and an active AOC plan (AOC Pro or higher); see pricing. The symbol search and AI button in the top bar work the same way as on Multi OI Graphs, and the data is always the current expiry on the latest trading day.
If you only want one strike, the single-strike Percentage Graph opens straight from a cell in the option chain. This page is for watching several at the same time.
What do the percentages mean?
On the option chain, the strike with the highest call volume is 100% for call volume, and every other call strike shows its volume as a percentage of that. The same goes for OI and OI change, on each side separately. Those are the numbers this page plots over time.
So a 24,600 CE volume line at 62% means its volume is 62% of the busiest call strike right now. When the line hits 100%, it has become the busiest call strike.
- Volume (blue): volume % of that strike and side.
- OI Chng (orange): OI change % of that strike and side.
- OI (purple): OI % of that strike and side.
- Dashed grey line: your Highlight threshold, 75% by default. It is the same setting that paints the light yellow highlight on the option chain, and you can move it between 25% and 95% in settings.
How do I add CE and PE strikes?
- Pick CE, PE or Both on the switch to the right of the strike strip. This decides which side the next tap adds.
- Tap a strike in the strip. With CE it adds or removes the call card, with PE the put card, and with Both it adds both cards (or removes both if both are already on).
- Each selected strike shows a small CE, PE or Both badge in the strip, so you can see what is on.
- Each card is titled like % CE 24,600. Use the X on a card to close just that card.
- Use the - and + buttons to set cards per row, and tap legend names to hide or show a line.
- 1CE, PE or Both switch
- 2Selected strike with its Both badge
- 3Card title, e.g. % CE 22,500
- 4X closes one card
- 5Legend: Volume, OI Chng, OI
How do I read a multi percentage chart?
NIFTY is at 24,520 and you have 24,500 PE, 24,600 CE and 24,700 CE on screen. At 10:00 the 24,700 CE card shows Volume at 100%: the busiest call strike. By 13:15 the 24,600 CE Volume line has climbed from 45% to 100% and 24,700 CE has slipped to 70%. Activity on the call side has moved one strike closer to the market.
Now look at OI Chng on 24,600 CE. If it also crosses the dashed 75% line and keeps rising, writers are not just trading it, they are holding new positions there. Traders read that as resistance shifting down from 24,700 to 24,600.
On the put side, if 24,500 PE OI sits at 100% all day while its OI Chng line stays above the threshold, the support at 24,500 is holding. A fall in its OI line with a rise in 24,400 PE tells you the support is moving lower.
What should I watch out for?
A percentage is relative. If the top strike loses volume, every other strike's percentage goes up even when nothing changed there. Check the raw numbers on All Volume Bar Graphs or the option chain before acting on a jump.
Early in the session the percentages swing hard because the totals are still small, so give the lines some time before reading much into them.
Frequently asked questions
What is the difference between Percentage Graph and Multi Percentage Graphs?
Percentage Graph shows one strike and side, opened from the option chain. Multi Percentage Graphs puts many CE and PE strikes on one page, each on its own card, so you can compare how their volume, OI and OI change percentages move together.
What does 100% mean on the percentage graph?
100% means that strike has the highest value in that column of the option chain for its side at that moment. For example, 100% call volume means it is the most traded call strike right then.
Can I change the dashed line on the percentage graphs?
Yes. The dashed line is your Highlight threshold setting, 75% by default. You can set it anywhere from 25% to 95% in settings, and the option chain's light yellow highlight uses the same value.
Do Multi Percentage Graphs update live?
Yes. The day's history loads first, then each card adds new points from the live option chain feed during market hours, without a manual refresh.
Last updated